FICTIONAL HOUSE

A sample report, one screen at a time

This page follows one fictional house through the whole wizard, from the first question to the results screen and the PDF report you can download at the end.

  1. 1 House
  2. 2 Envelope
  3. 3 Equipment
  4. 4 Weather
  5. 5 Run
  6. 6 Results
  7. PDF report

Select a screenshot to open it at full size.

The house

A detached house in Luxembourg, built in 2025. Two storeys of 10 m by 10 m sit over a heated basement, under a pitched roof with an unheated attic. A garage inside the house is not heated. An air-source heat pump feeds underfloor loops that also cool in summer. A separate small heat-pump water heater serves the hot-water tank, and a ventilation unit recovers heat from the outgoing air.

The roof carries 13.5 kWp of solar panels split between east and west. There is a 15 kWh battery, and one electric car charges at home. Four people live there, on a fixed electricity price, in a typical weather year.
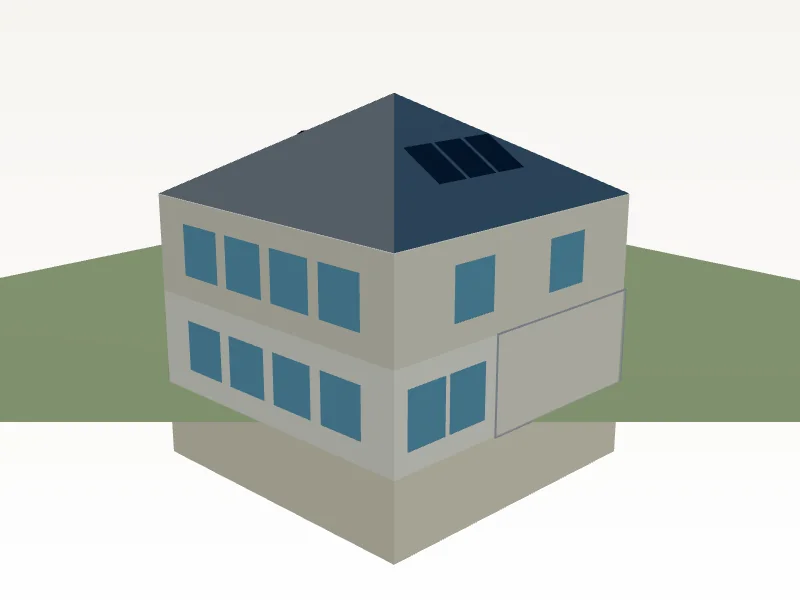
A 3D model of the fictional house seen from the south-east. It has two storeys over a basement that sits below the ground line, windows on both floors, the outline of a garage on the lower floor and a hip roof with solar panels on its east face.
The wizard's 3D view of the house. The panels on the east roof face show; the west ones are out of sight.

Step 1 of 6

Describe the house

You choose the house type, the number of storeys, the roof, any basement or garage, the year it was built and a postal code. The postal code sets the weather and the position of the sun. Windows are counted by floor and by compass face.
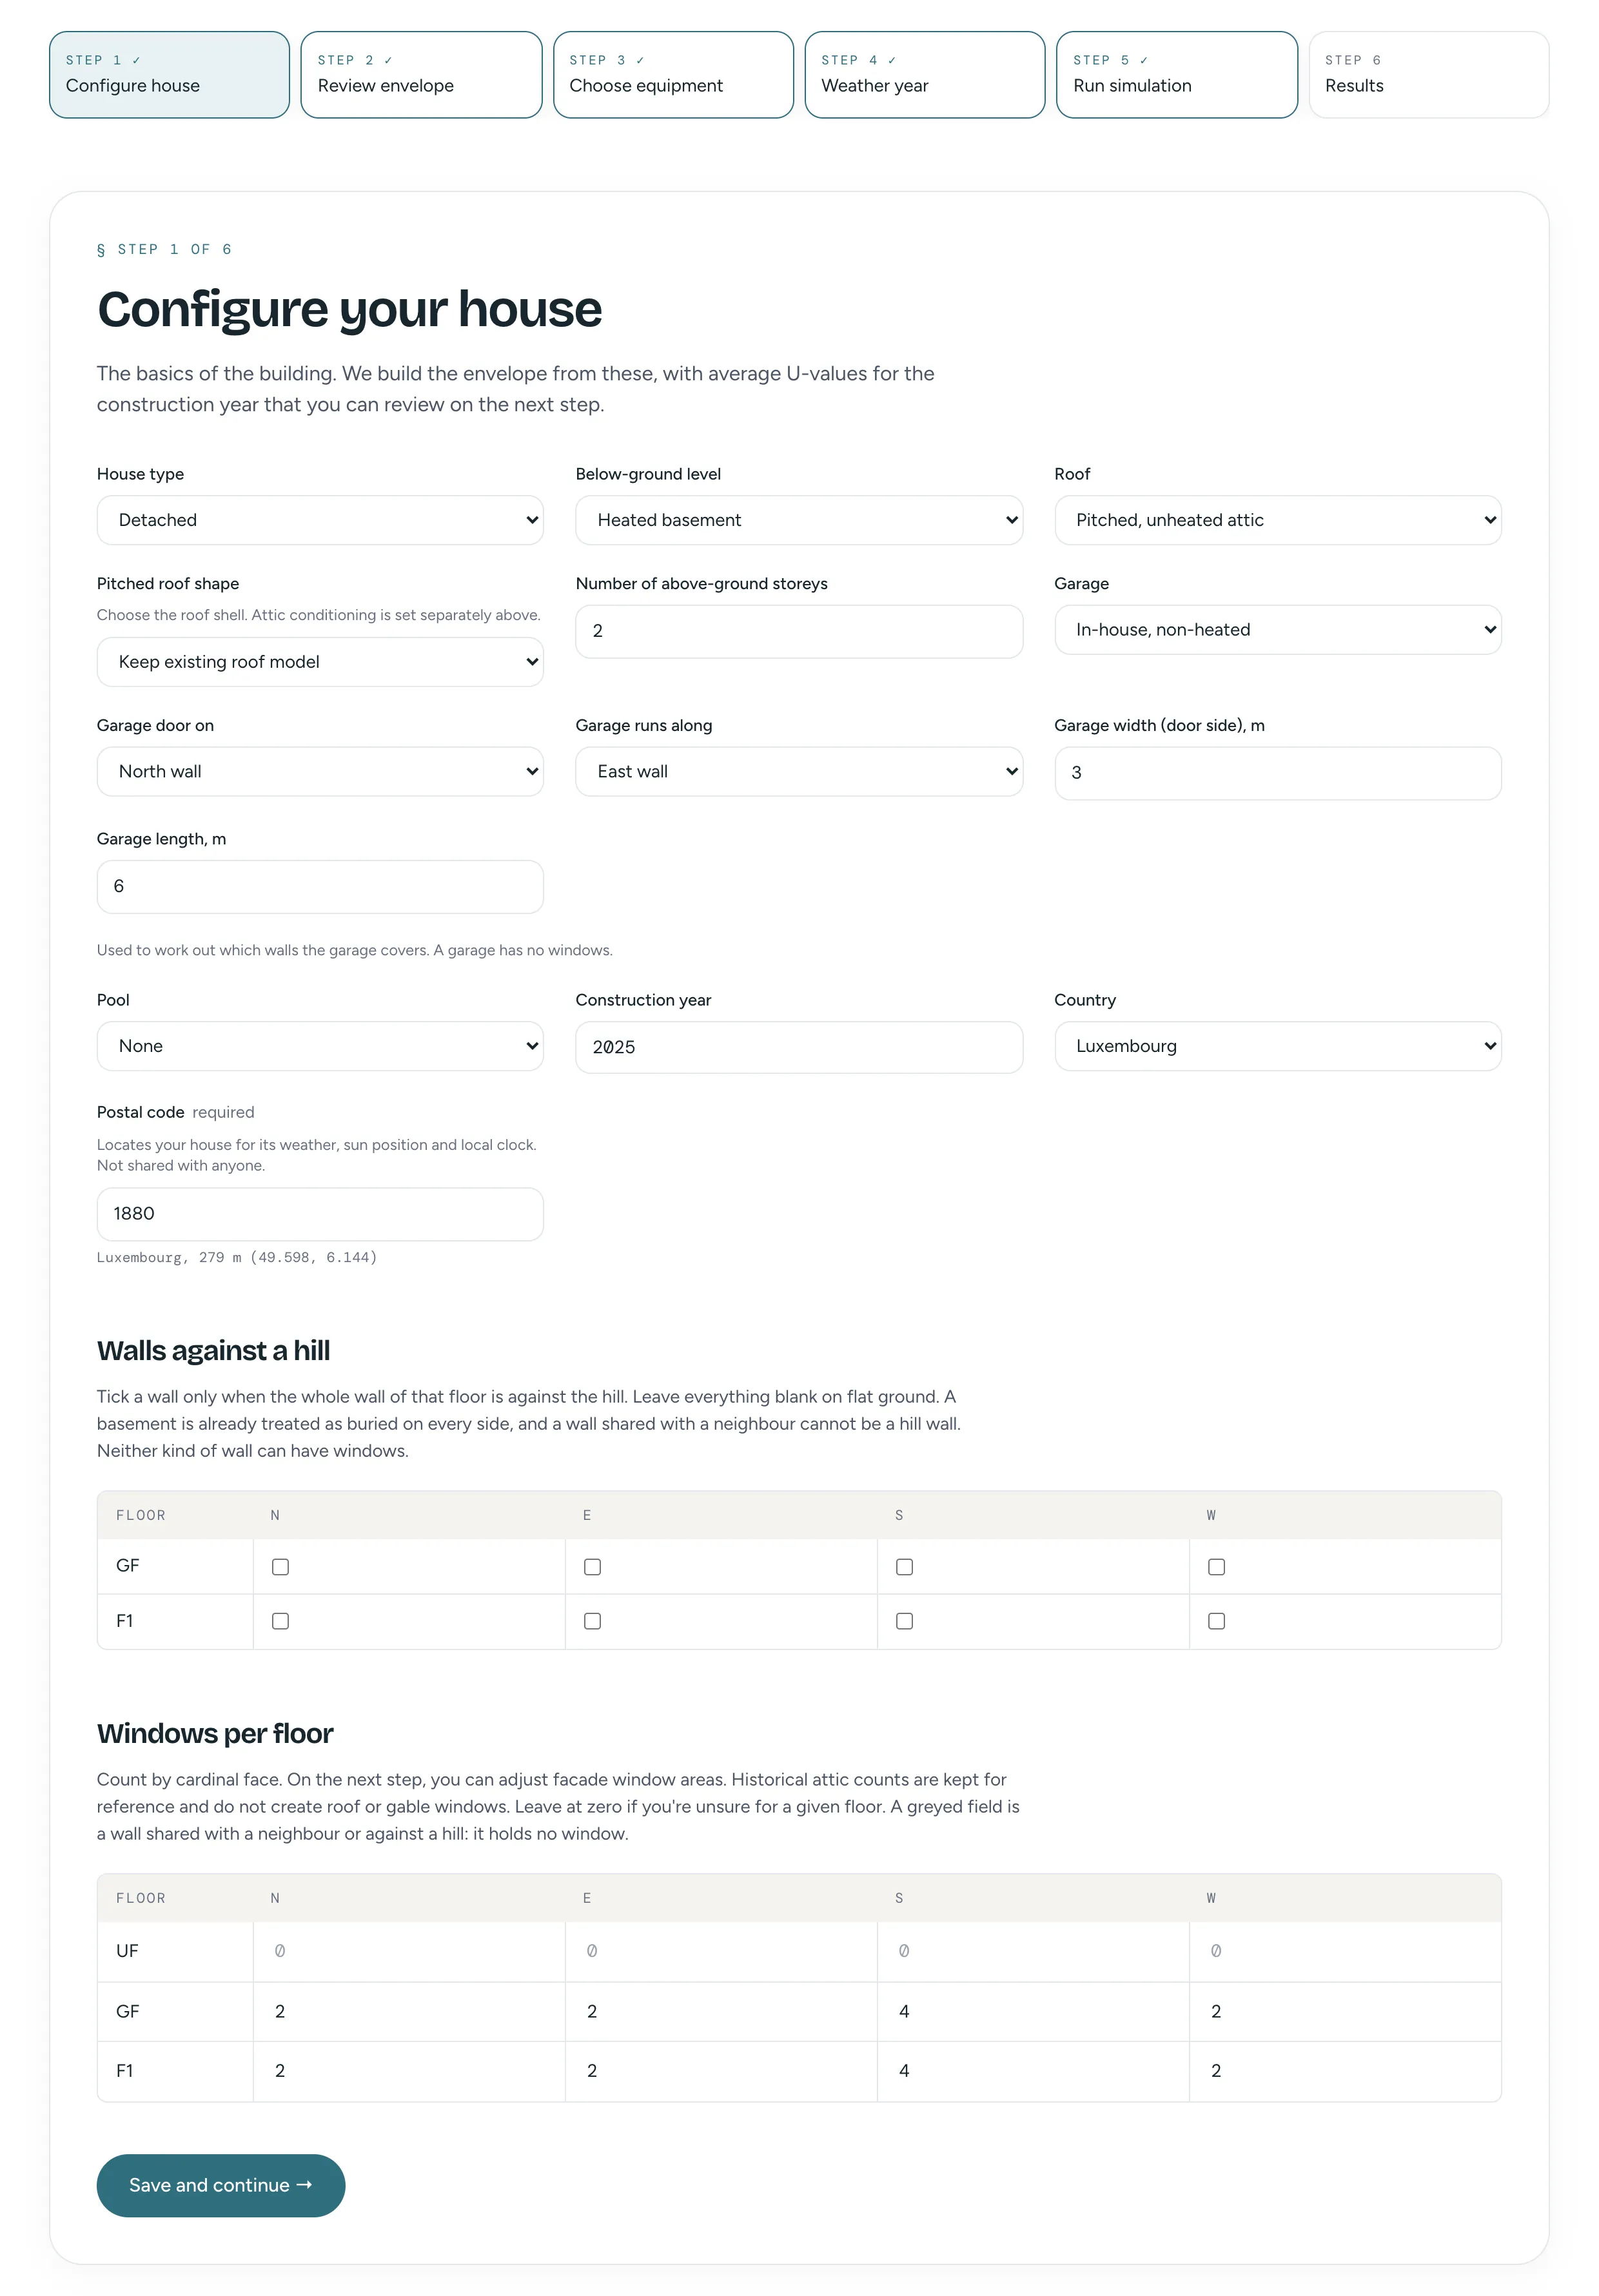
The Configure your house screen. The house type is detached, with a heated basement, a pitched roof over an unheated attic, two storeys, an unheated garage inside the house, built in 2025, in Luxembourg with postal code 1880. A table lists the window count on each face of each floor.
Step 1 of 6, as filled in for this house.

Step 2 of 6

Check the envelope

EnergyFlow builds the walls, floors, roof and windows from step 1 and the build year. You check the floor dimensions, set the glazed area on each face and adjust the staircase opening. Wall, roof, floor and window values come from a catalogue for the build year, and you can type your own if you have measured them. A 3D model of the house redraws as you change the numbers, and you can turn it with the mouse.
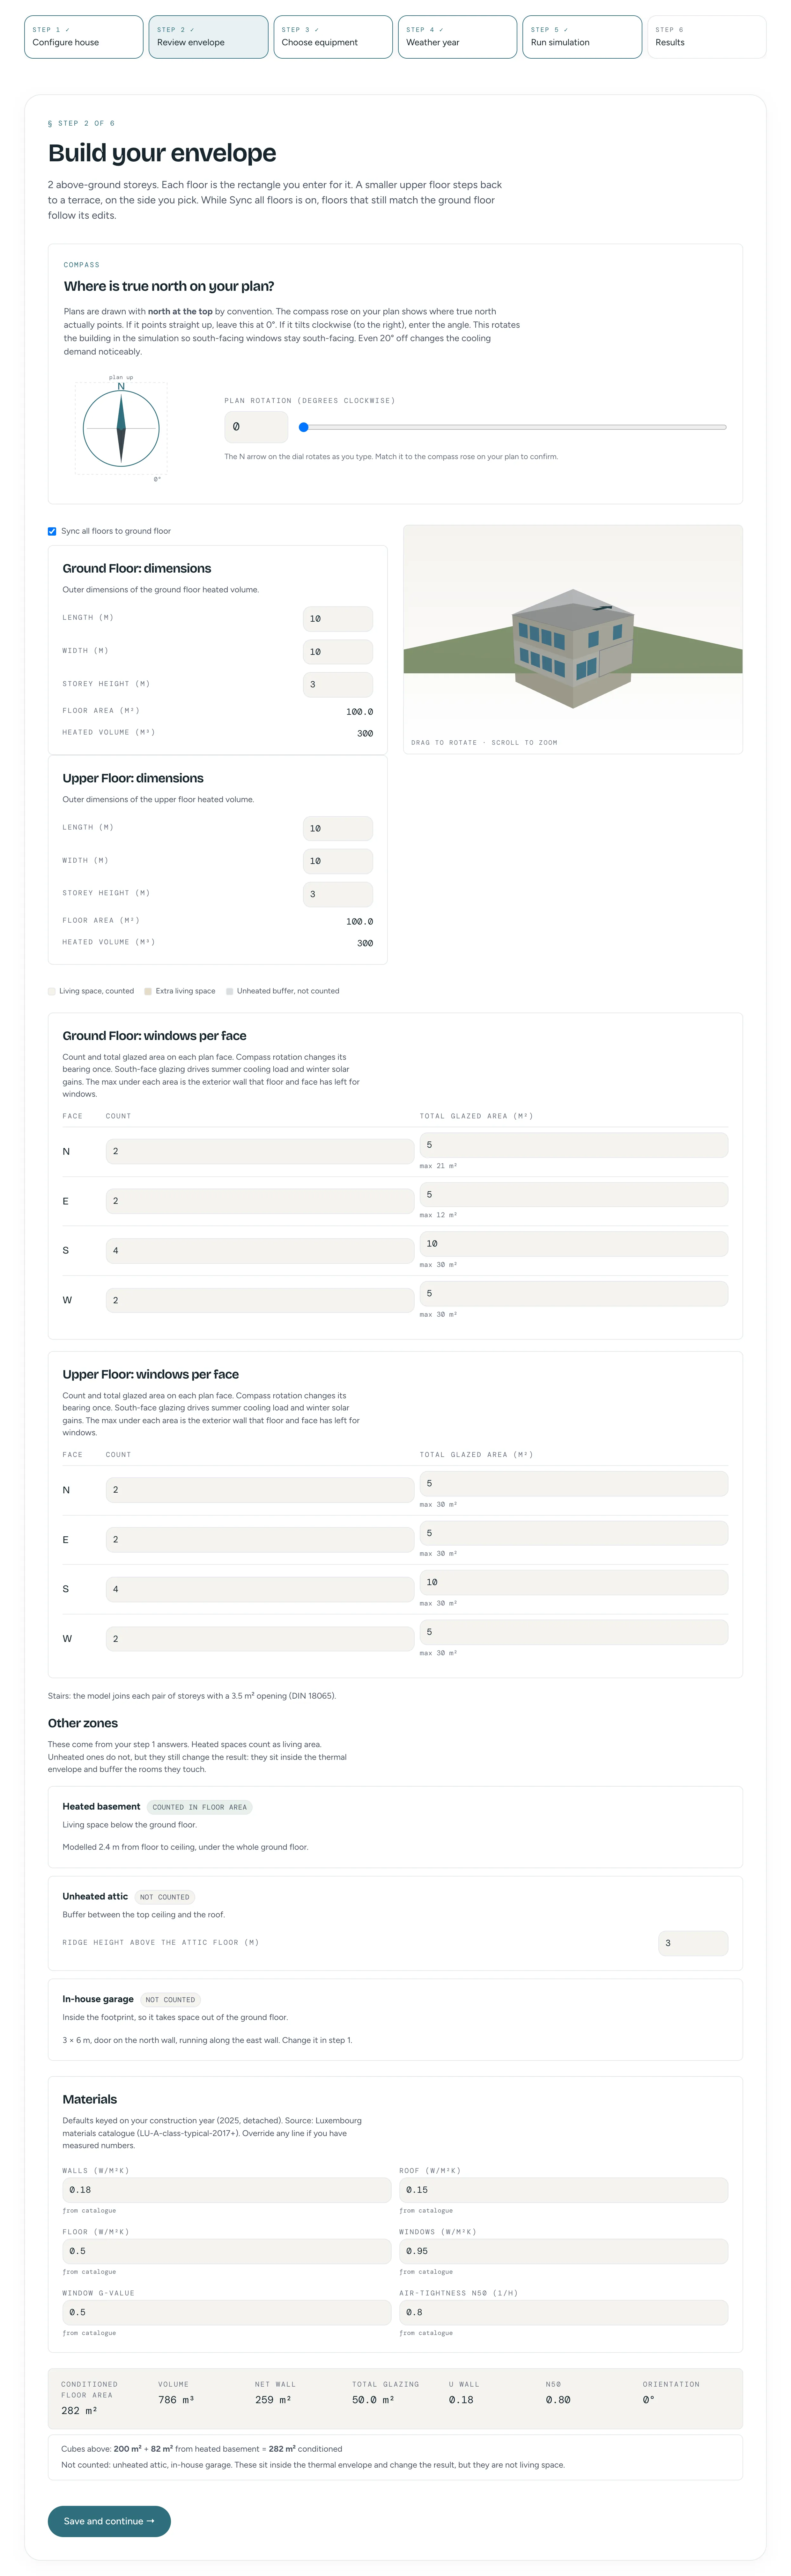
The Build your envelope screen. It has a compass rotation control, the dimensions of the ground floor and upper floor (10 m by 10 m each), a 3D model of the house, the window count and glazed area on each face of both floors, the staircase opening, the heated basement, unheated attic and garage, a materials list with wall, roof, floor and window values, and a summary row.
Step 2 of 6. The materials section is the catalogue defaults for a Luxembourg house built in 2025.

Step 3 of 6

Choose the equipment

Each category gets one tile: heat source, heating distribution, hot water, cooling, ventilation, battery, car charging and tariff. A tile that depends on an earlier choice stays grey until that choice is made. Solar panels are set face by face on a 3D model of the roof.
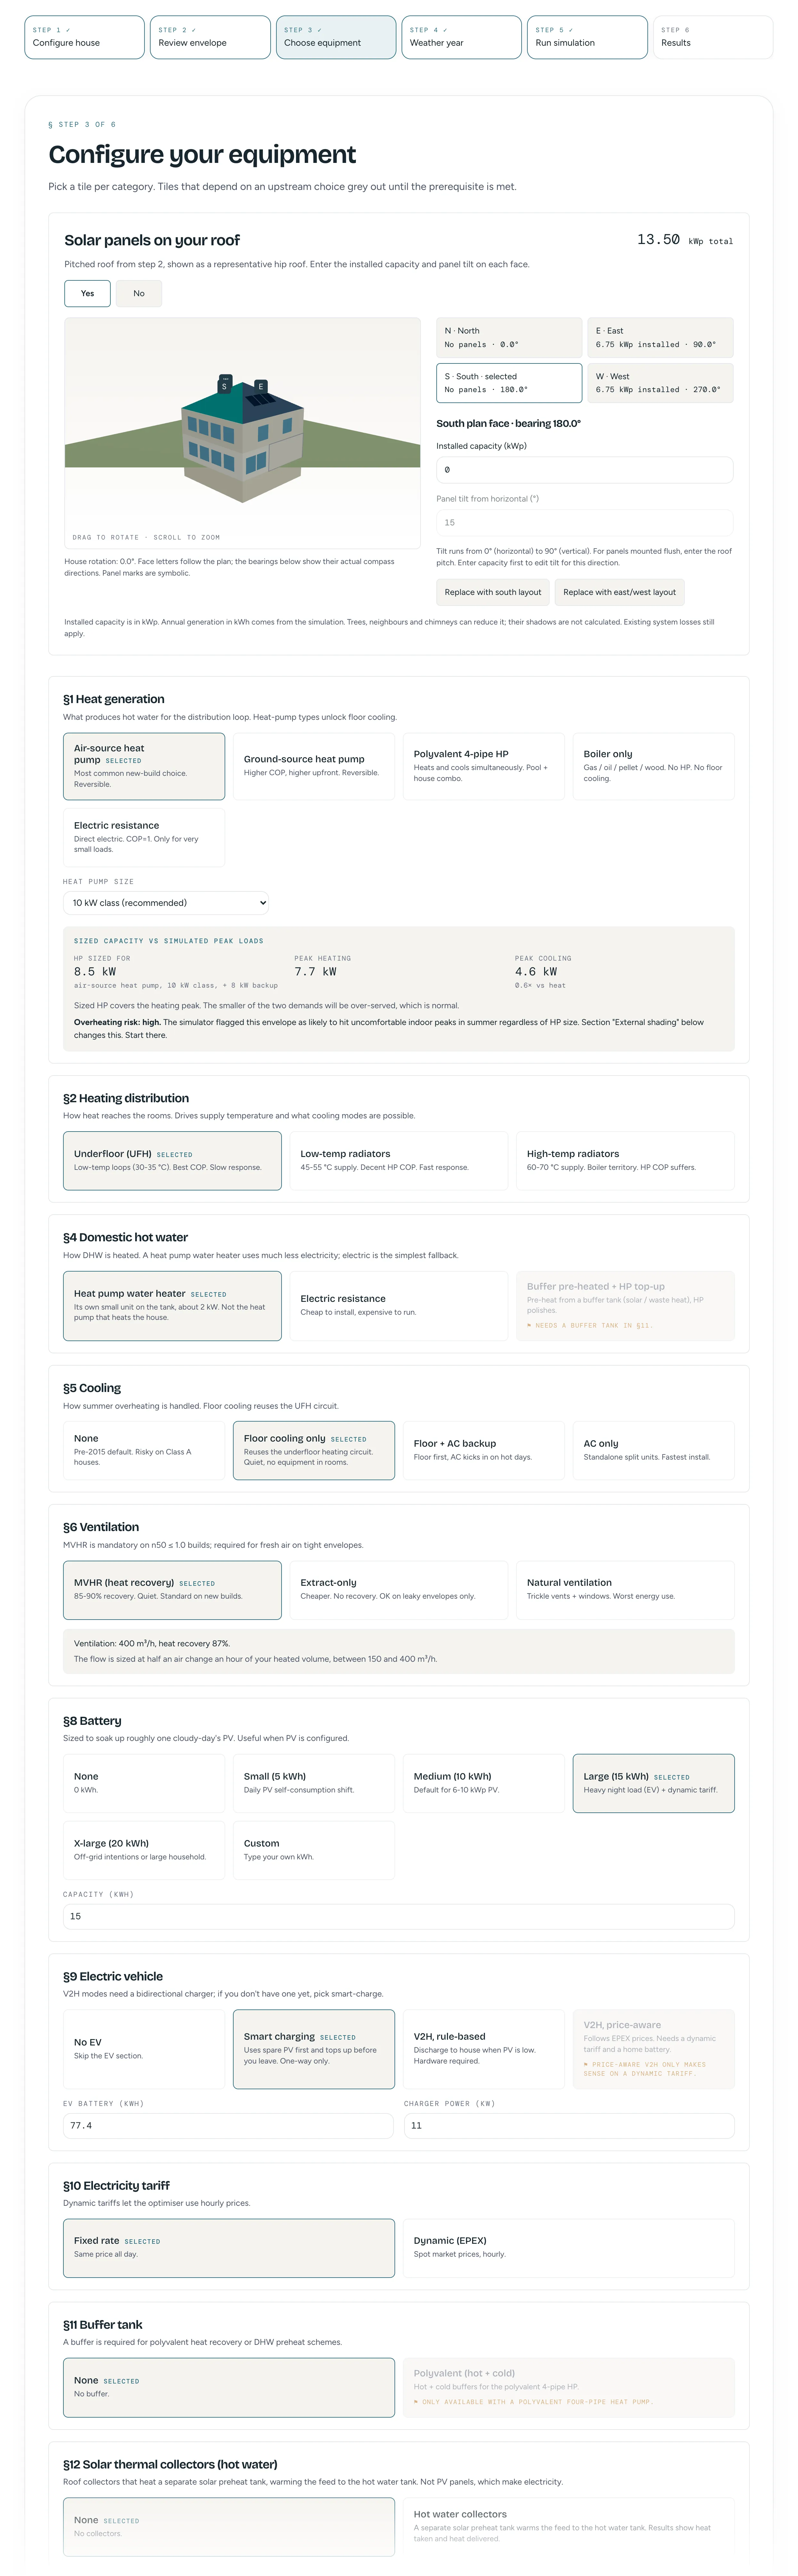
The top of the Configure your equipment screen. A solar roof editor shows a 3D model of the house with 13.5 kWp of panels split between the east and west roof faces. Below it is one block per category: heat generation (air-source heat pump selected, with a heat pump size menu set to the 10 kW class and a box that sets the sized capacity against the simulated peak loads), heating distribution (underfloor), domestic hot water (heat-pump water heater), cooling (floor cooling), ventilation (heat recovery), battery (15 kWh), electric vehicle (smart charging), electricity tariff (fixed rate), buffer tank (none) and solar thermal collectors (none). The hot-water tile is a separate small heat-pump water heater for the tank, not the house heat pump.
Step 3 of 6, top part only. The tank has its own small heat-pump water heater, separate from the house heat pump. Schedules, thermostat settings, shading and prices follow below.

Step 4 of 6

Pick the weather

A typical year shows how the house behaves in normal conditions. A real past year shows what that year would have done to it. This run uses a typical year.
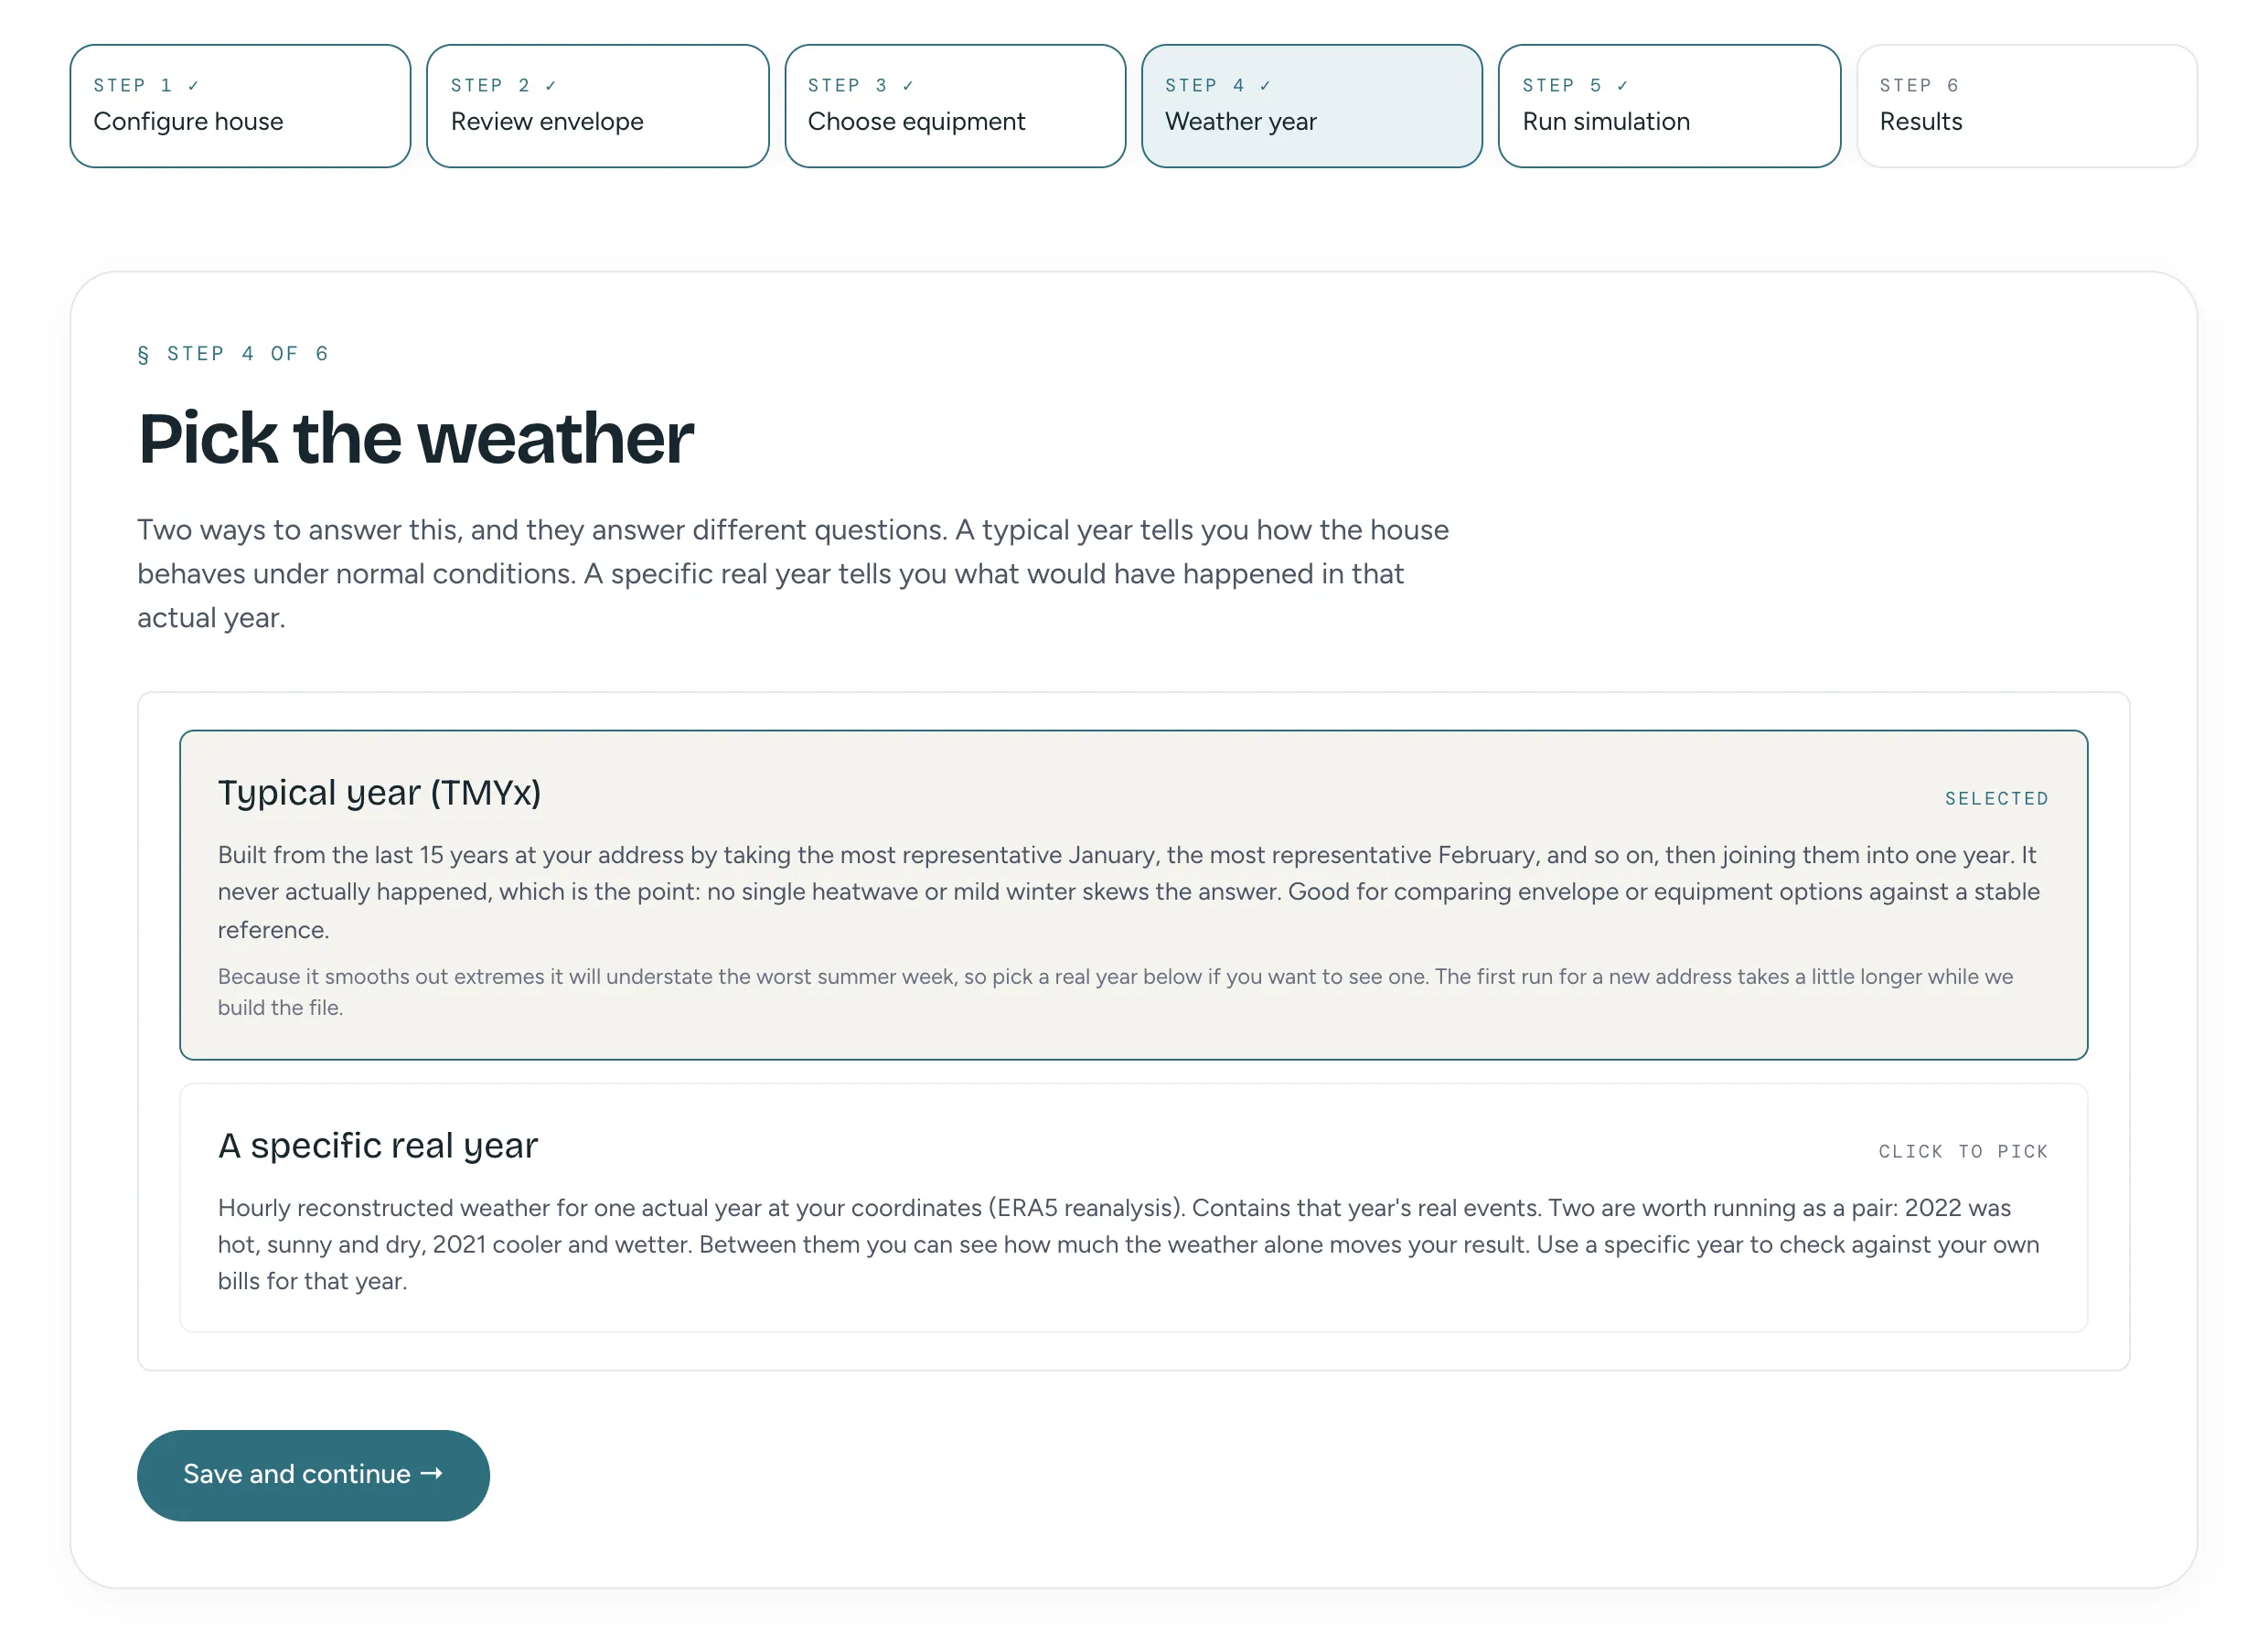
The Pick the weather screen with two options. A typical year (TMYx) is selected. A specific real year is the alternative.
Step 4 of 6.

Step 5 of 6

Run the simulation

One button. The run reads everything from steps 1 to 5 and returns annual heating, cooling, hot water and electricity use, monthly and daily balances, indoor temperatures and an hourly CSV.
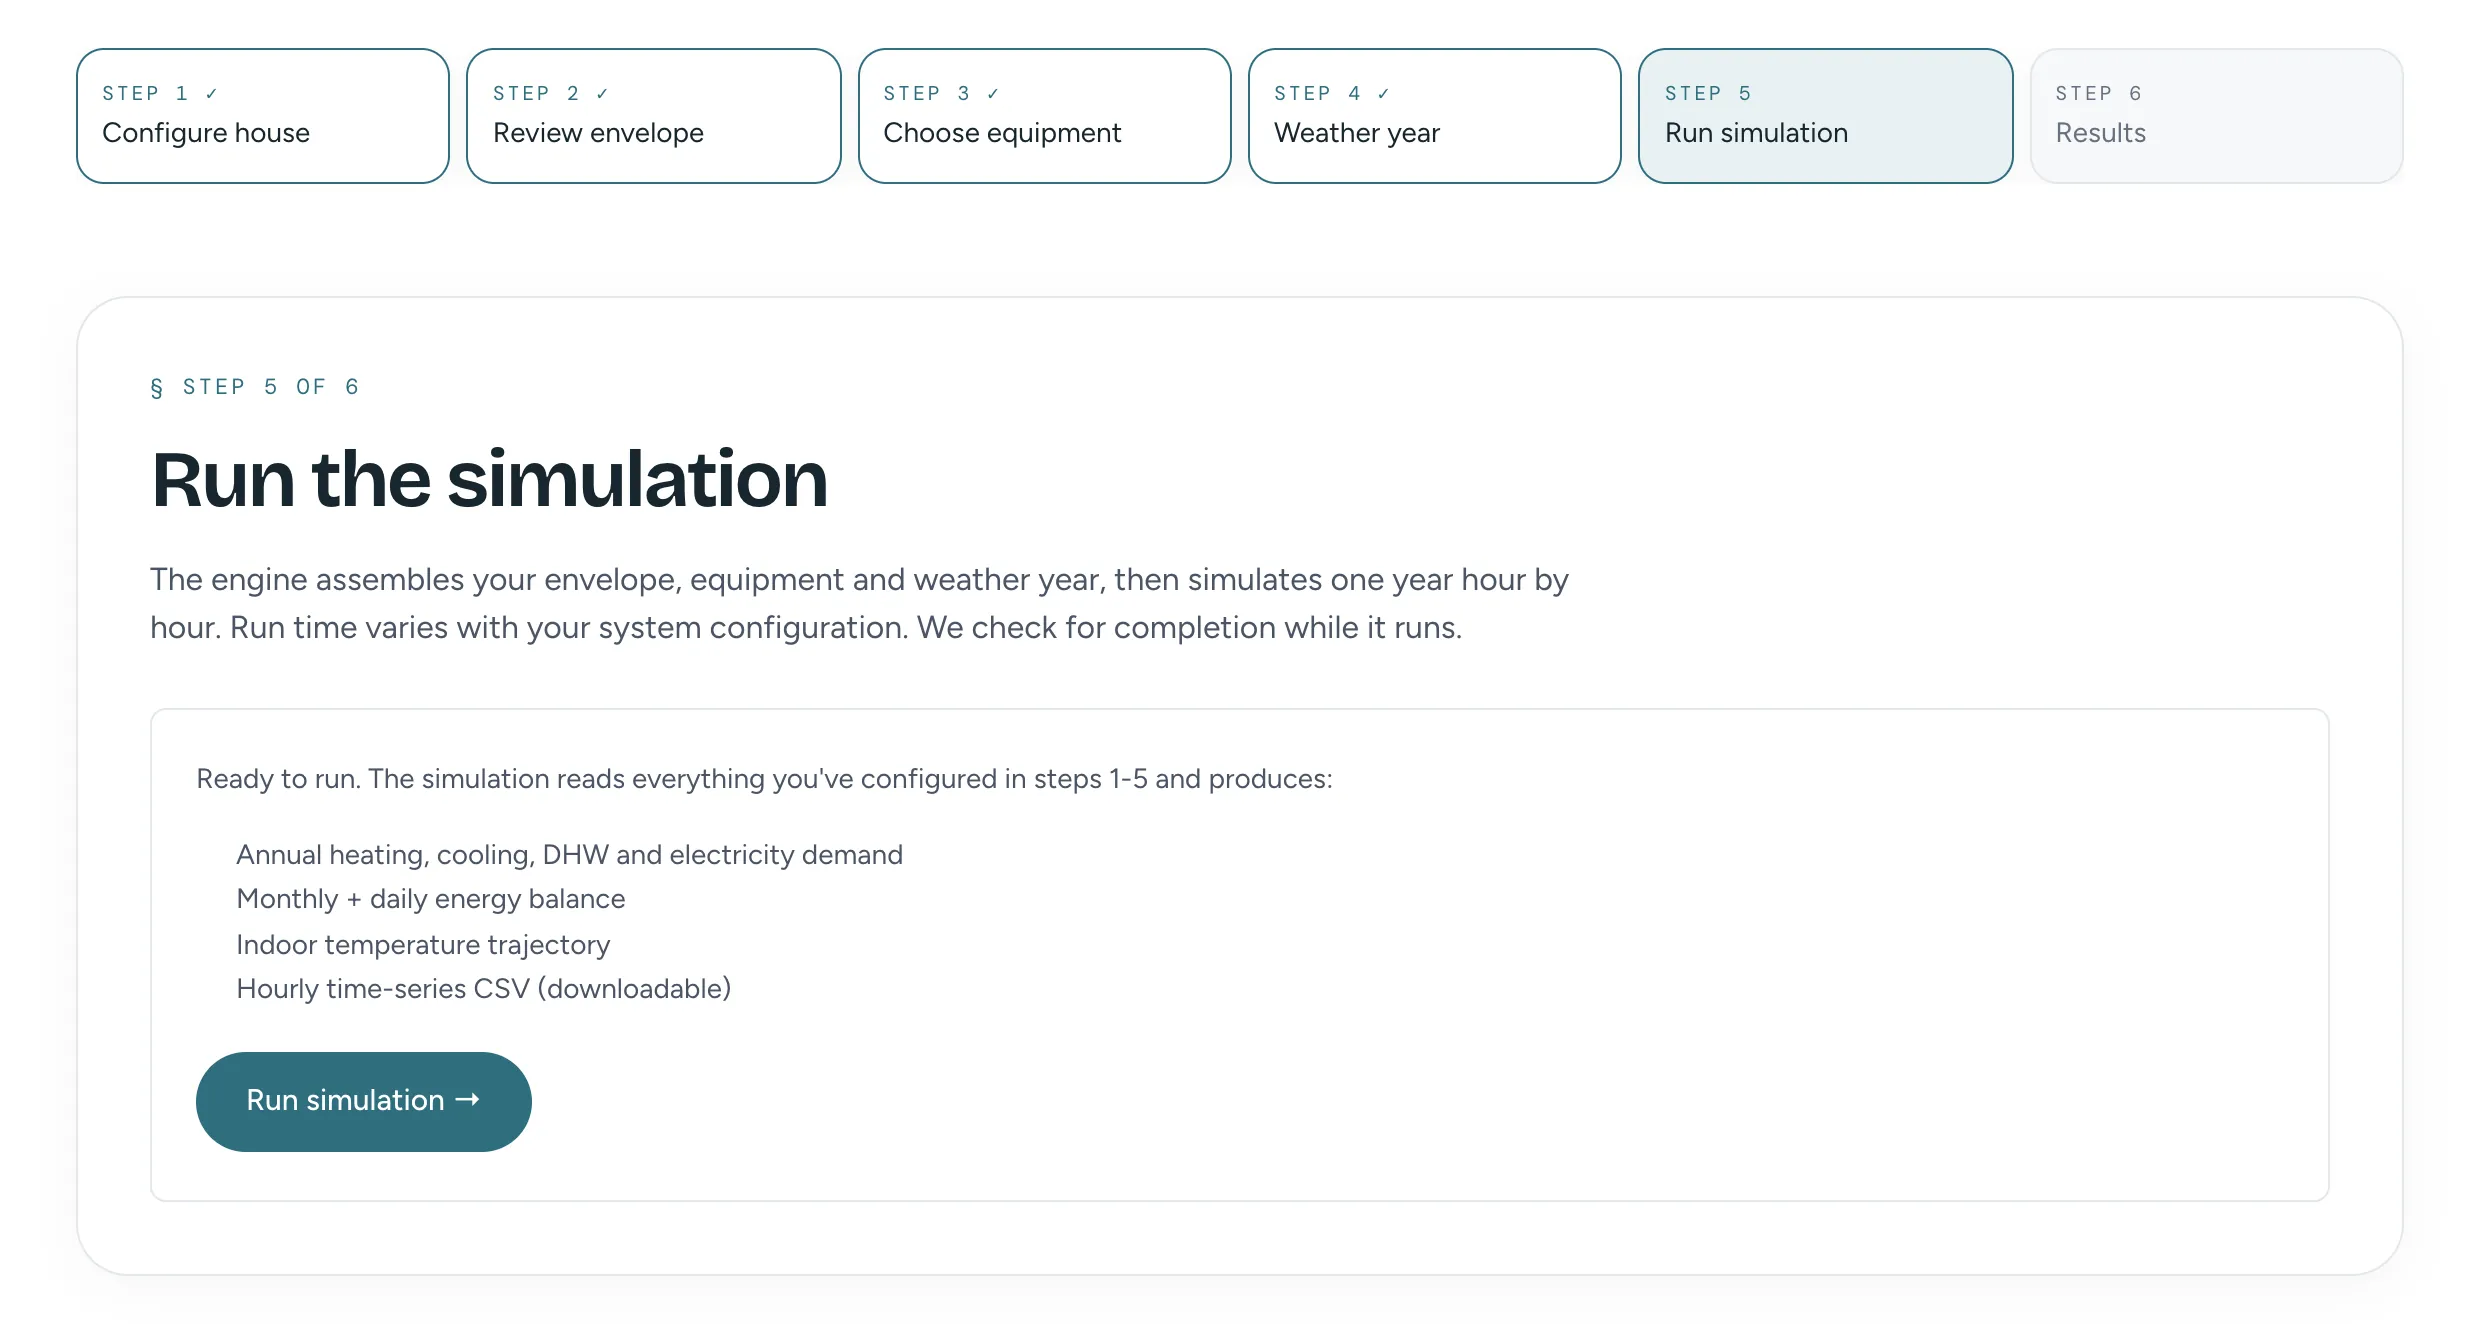
The Run the simulation screen. A short list says what the run produces, and a Run simulation button sits below it.
Step 5 of 6, before the run is started.

Step 6 of 6

Read the results

The results open with headline numbers and a short factual summary. For this house the year comes to 4,181 kWh of space heating, 2,890 kWh of cooling and 4,392 kWh bought from the grid. The modelled annual energy cost is 935 EUR, including a fixed grid charge of 432 EUR.
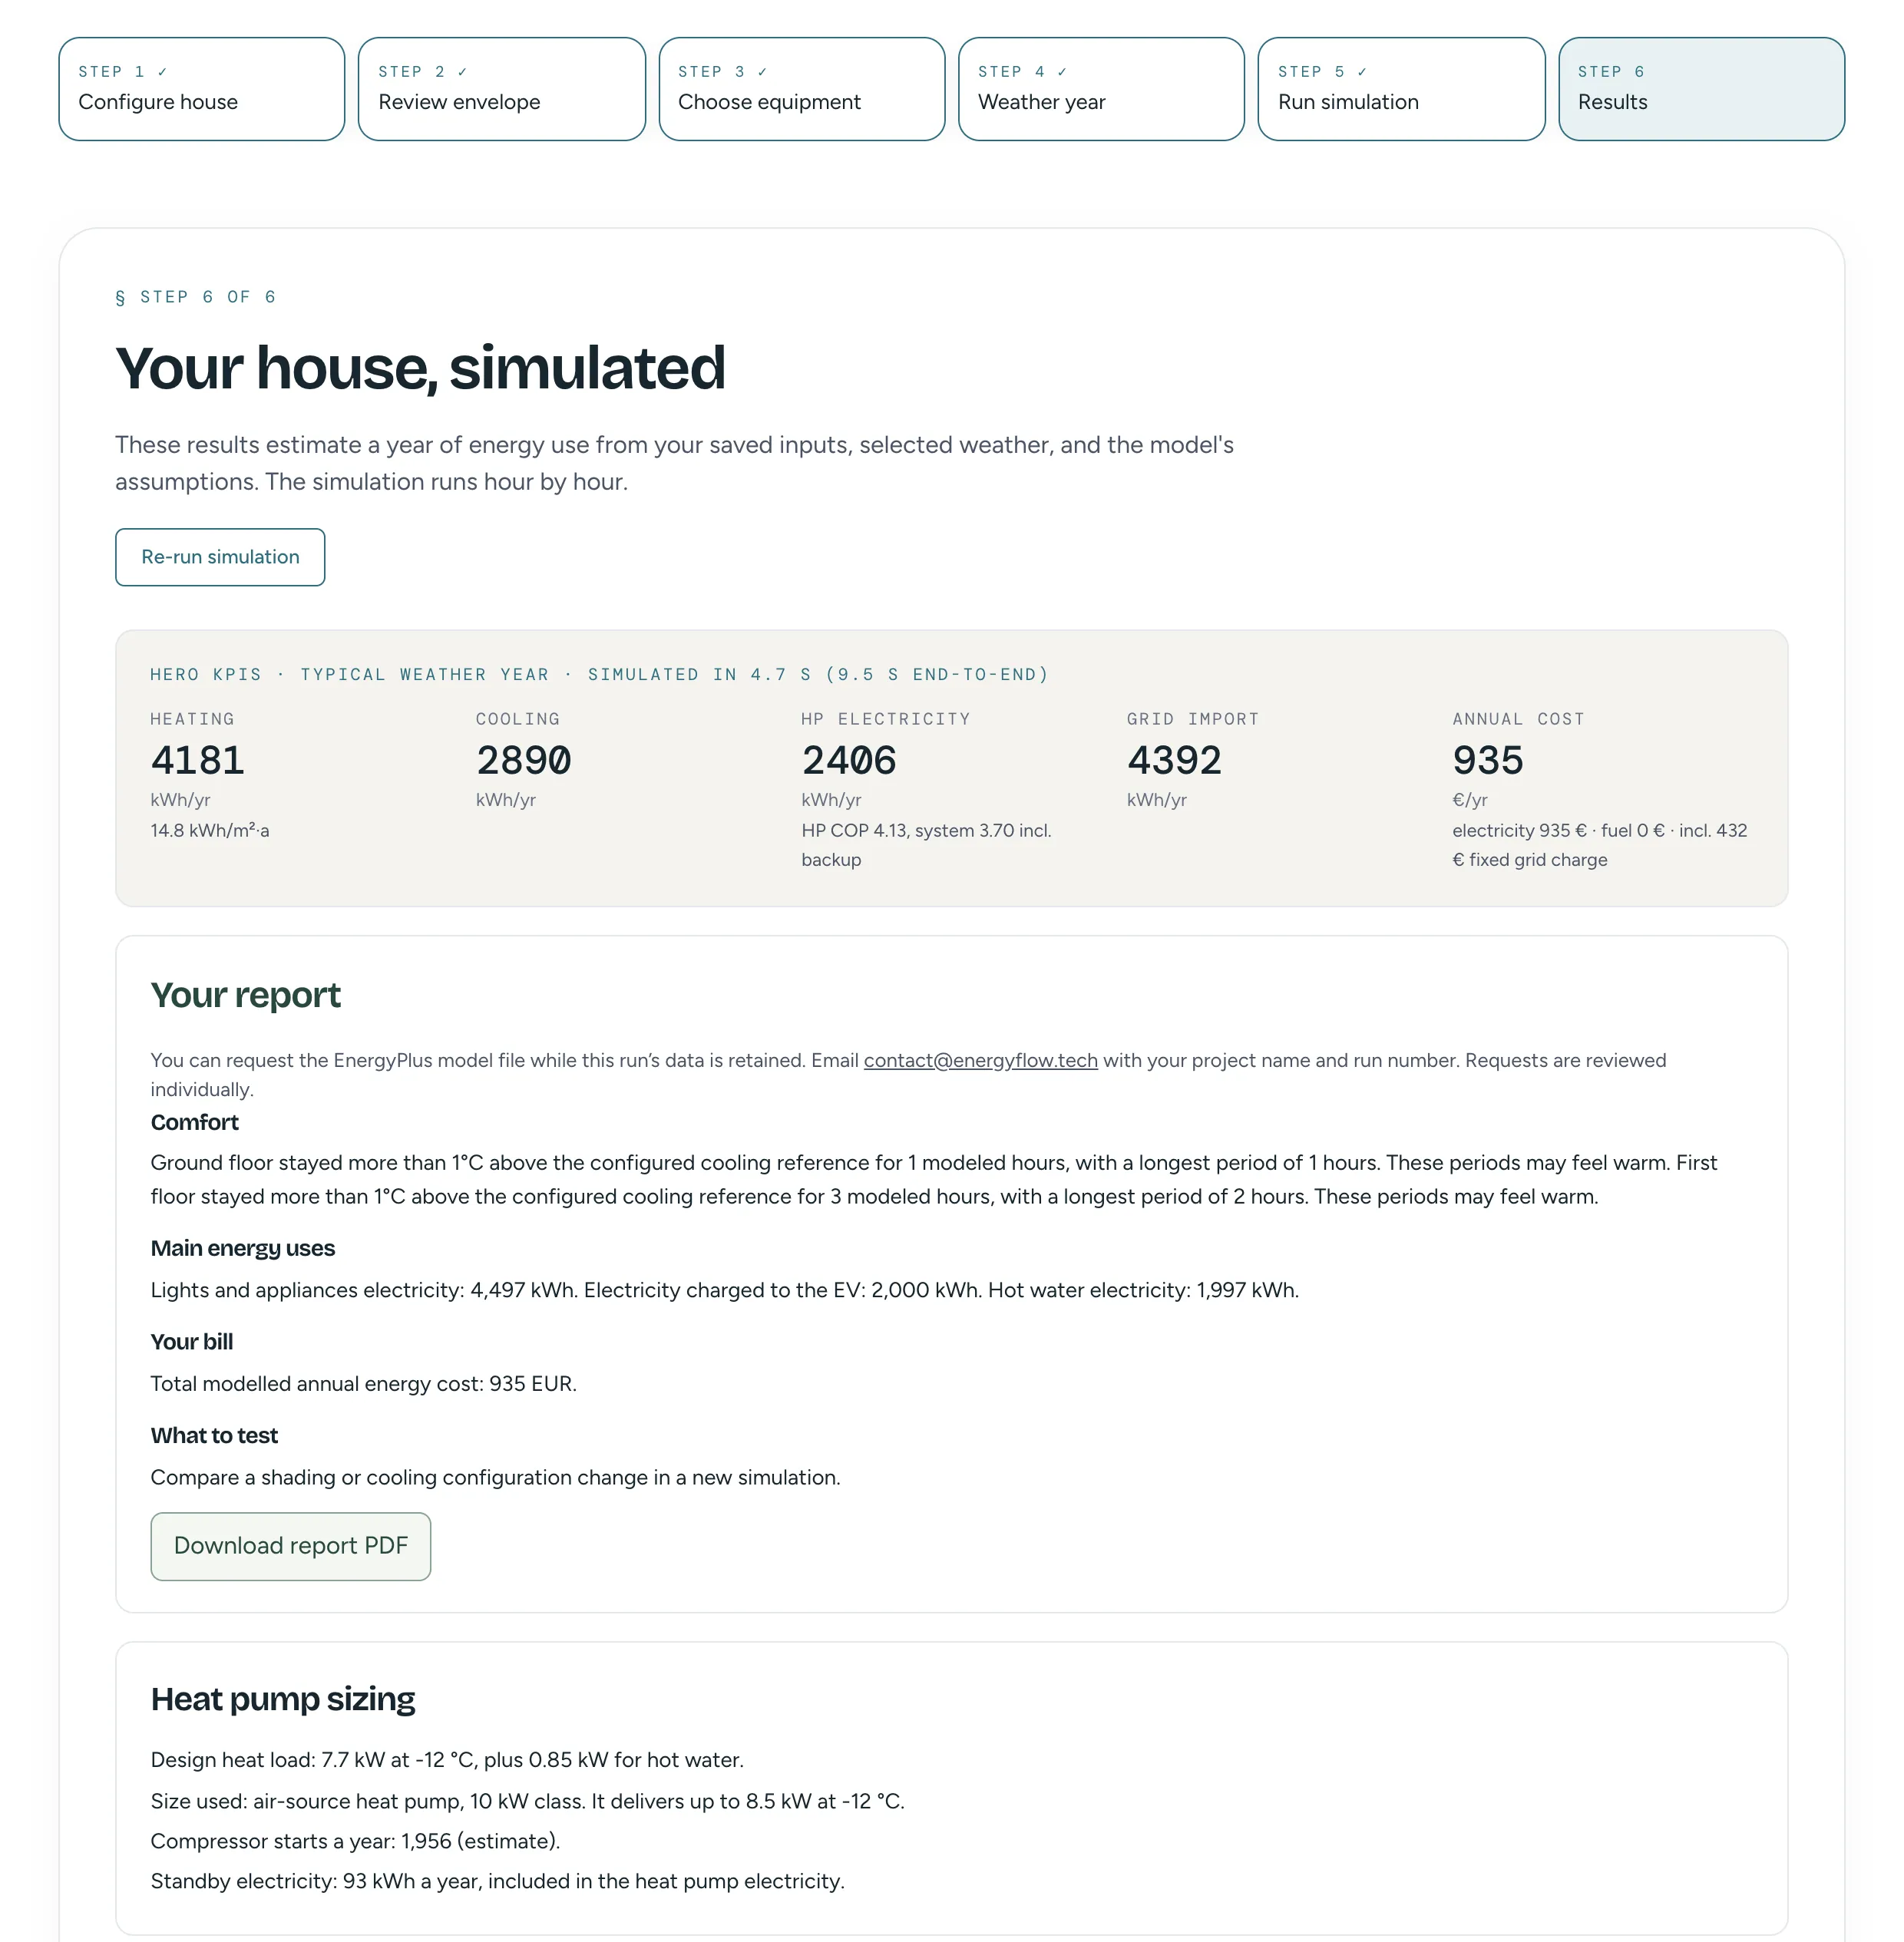
The top of the results screen. Headline numbers for the year: heating 4181 kWh, cooling 2890 kWh, heat pump electricity 2406 kWh, grid import 4392 kWh and an annual cost of 935 euros including a 432 euro fixed grid charge. Below them is a factual summary with comfort, main energy uses, the bill and what to test next, a Download report PDF button, and a short heat pump sizing block.
Step 6 of 6, the top of the results screen.

Below that, a monthly chart sets each use against solar production, and a daily chart shows solar, grid import and grid export.
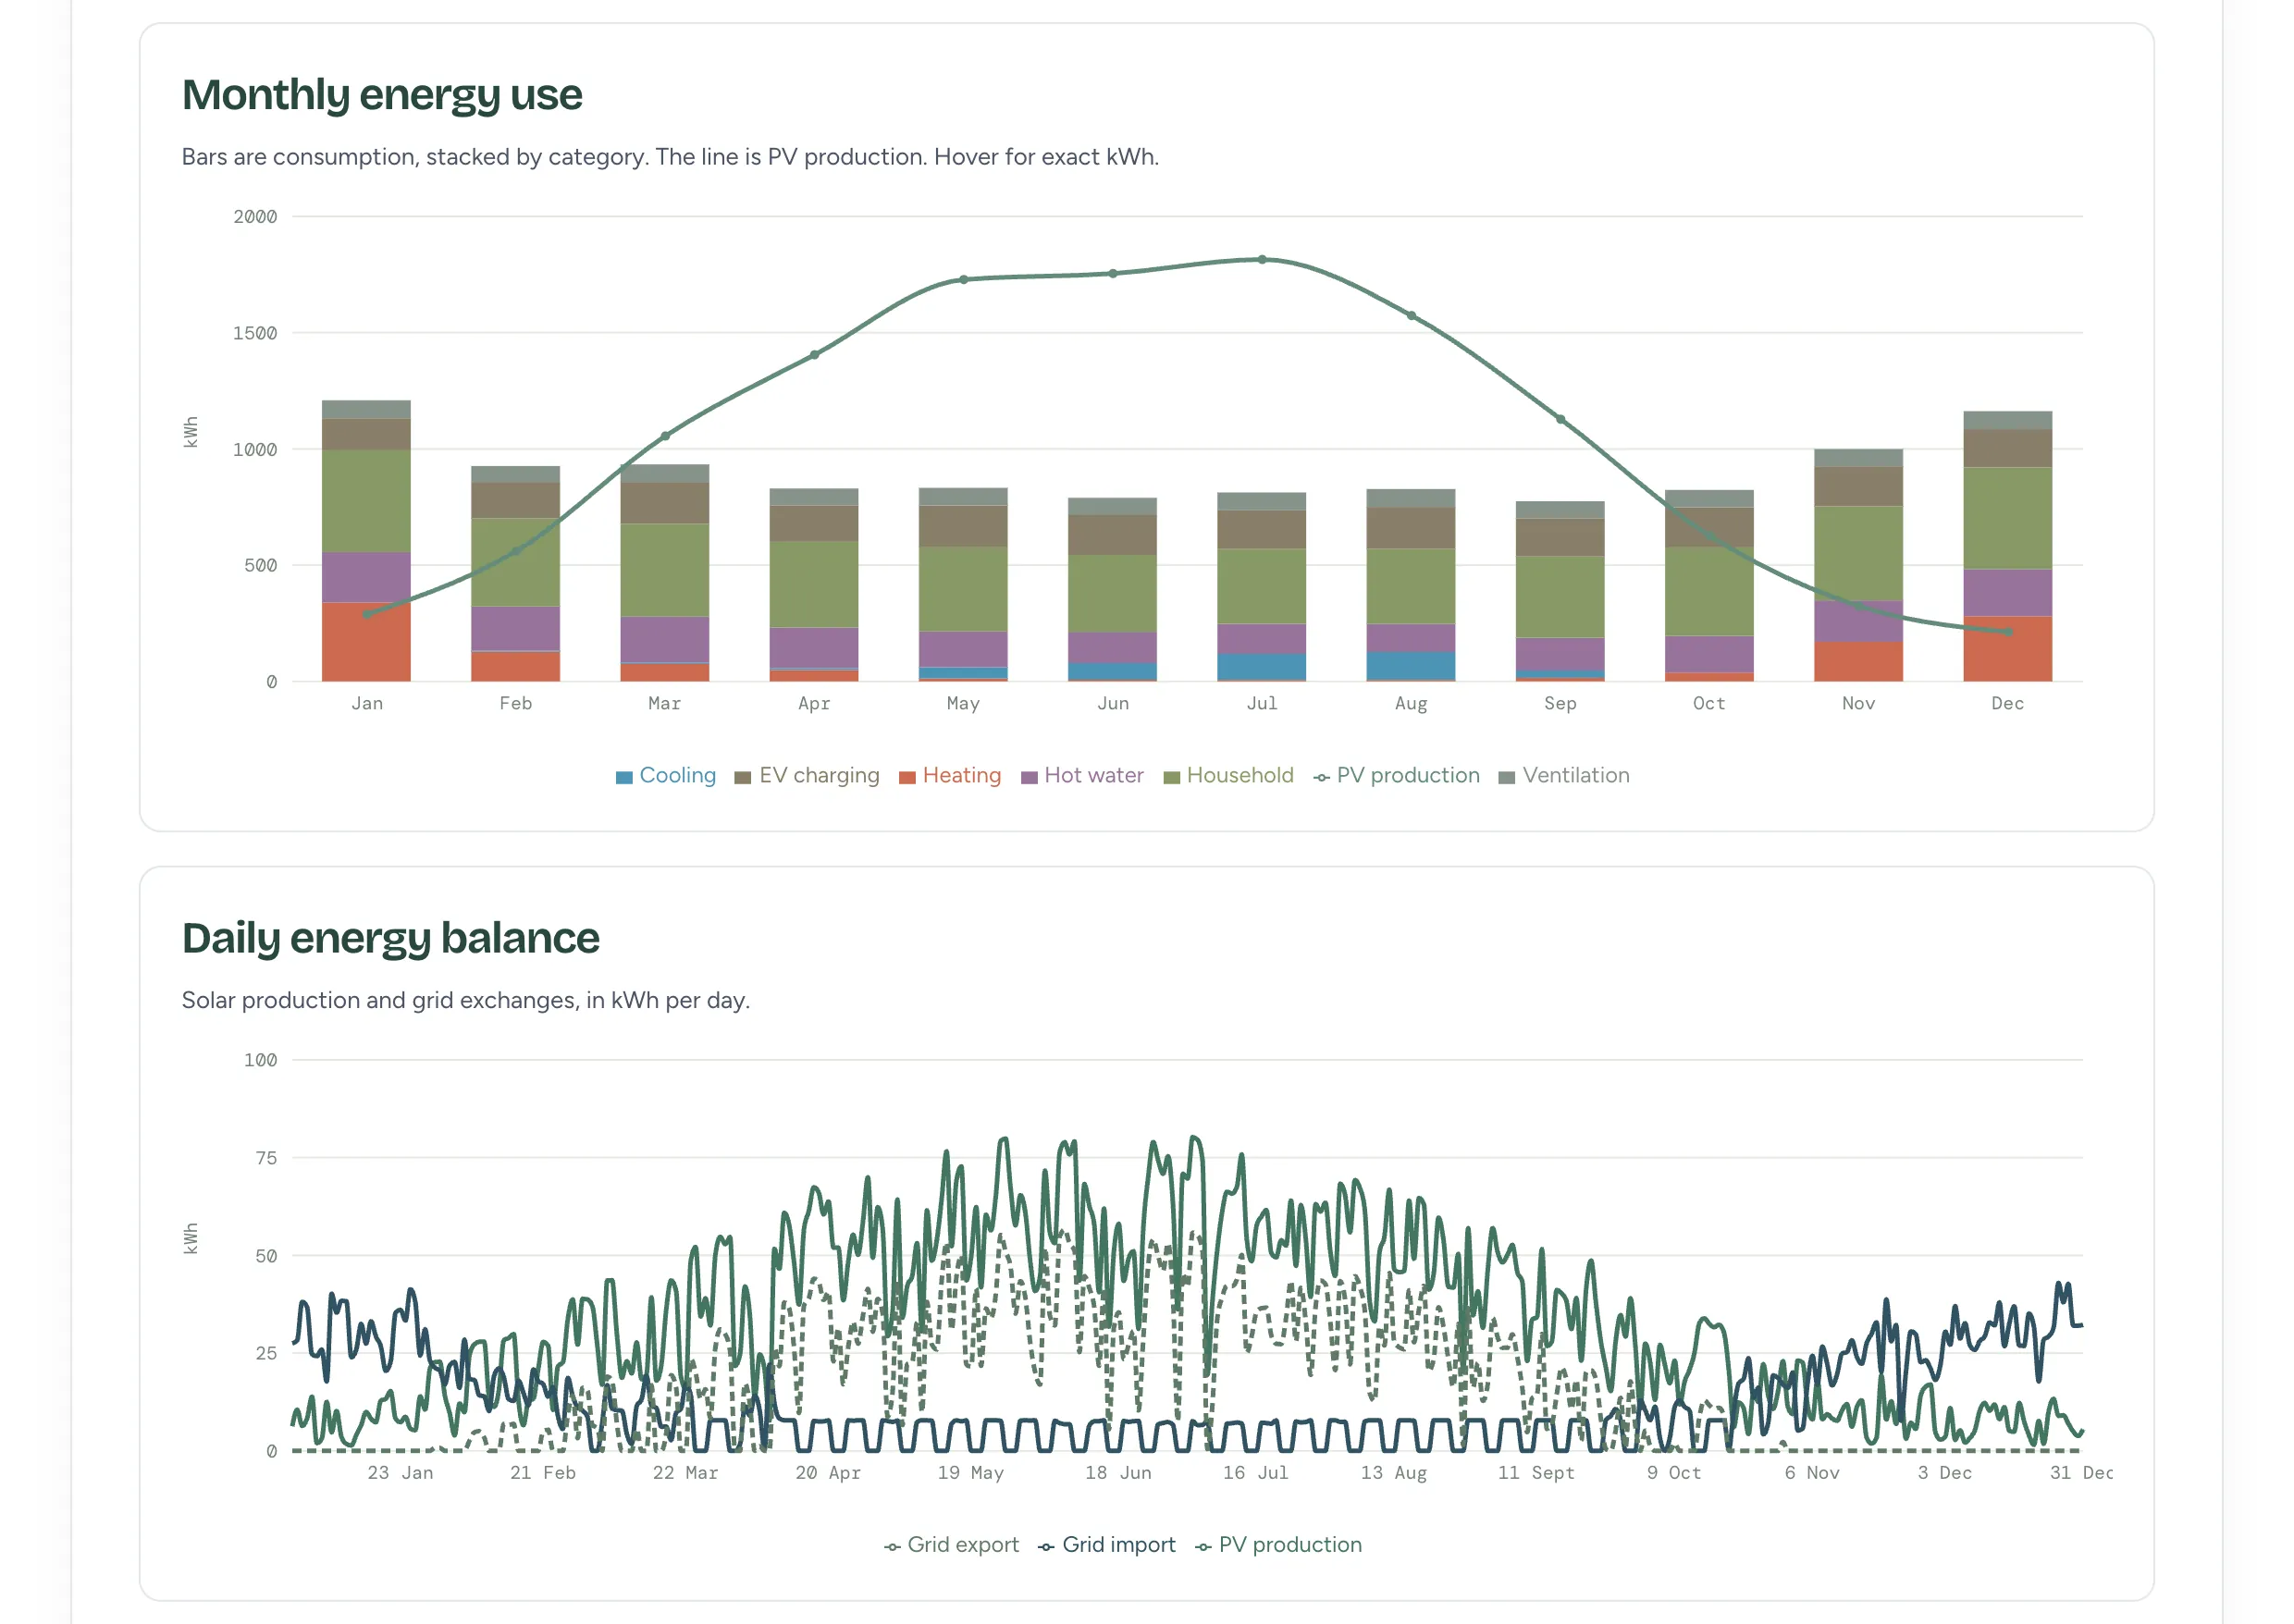
Two charts. Monthly energy use shows stacked bars for heating, cooling, hot water, household, EV charging and ventilation, with a line for solar production that peaks in July. Daily energy balance plots solar production, grid import and grid export for every day of the year.
Monthly and daily charts, from the same results screen.

A flow diagram follows solar and grid electricity through the battery and heat pump to each use. The panels generate 12,470 kWh over the year and 5,798 kWh goes out to the grid. A second diagram shows how the equipment connects.
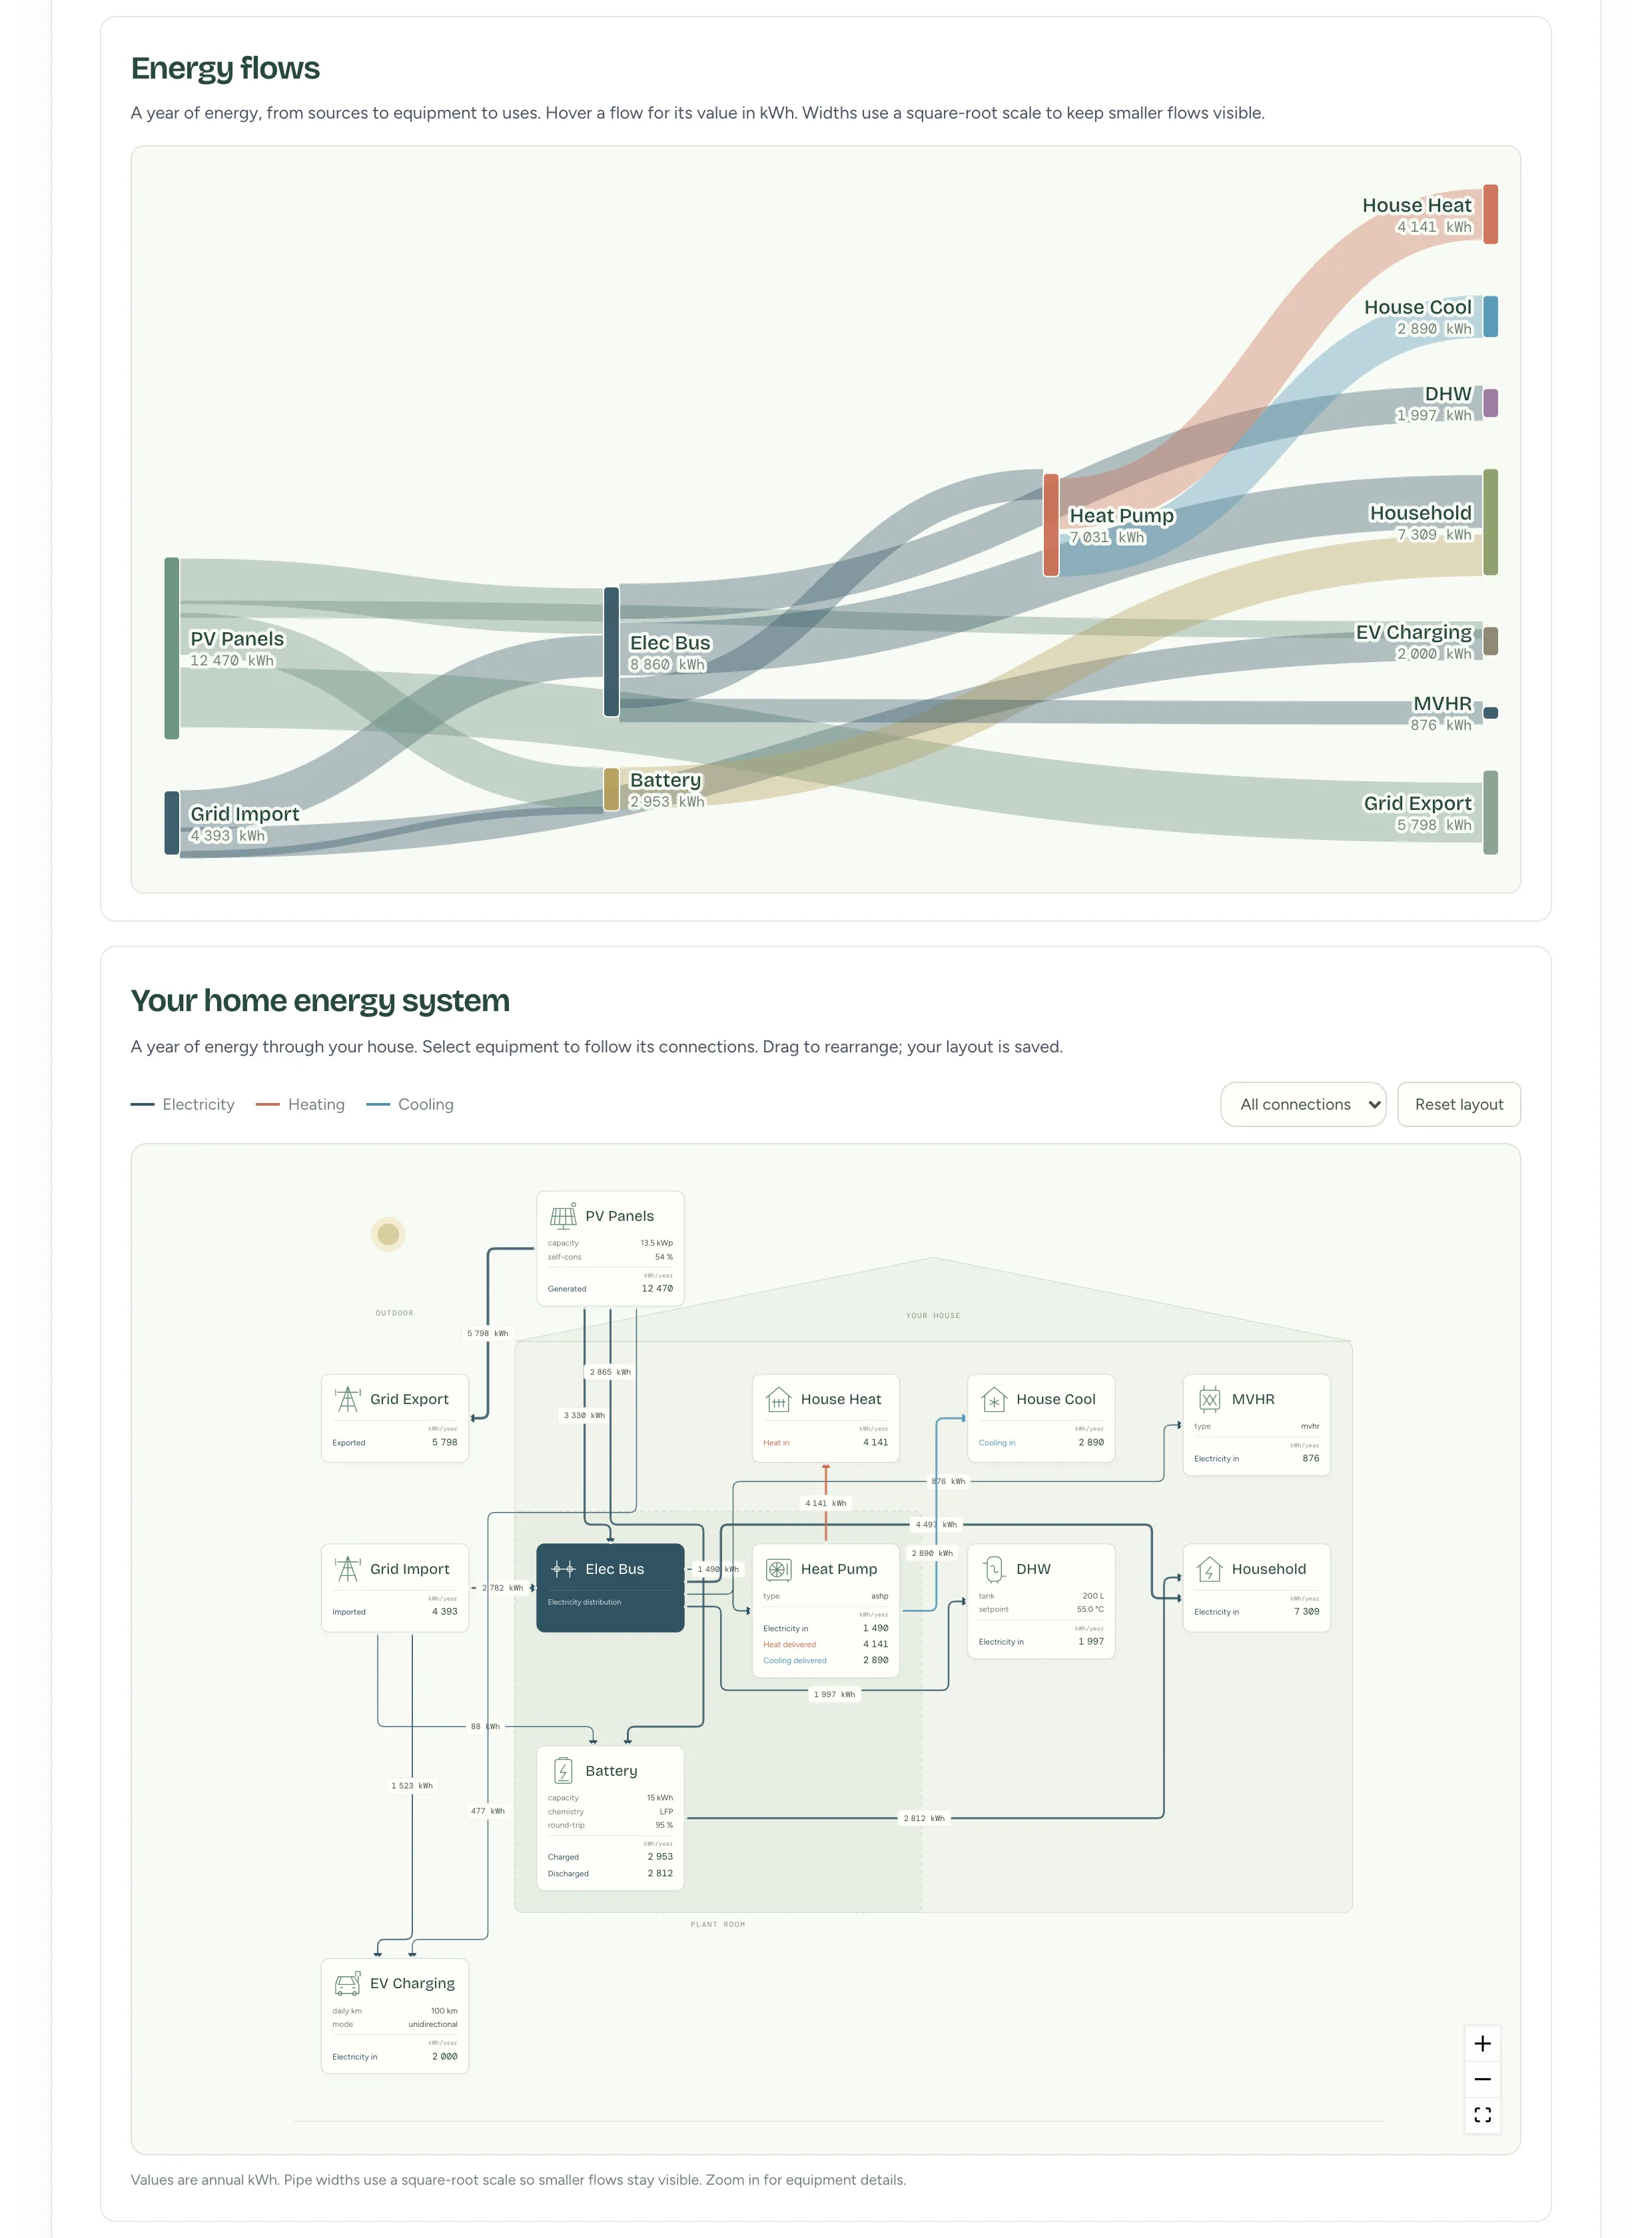
An energy flow diagram that follows solar panels and grid import through the electrical bus, battery and heat pump to house heat, house cooling, household use, EV charging, ventilation and grid export, then a diagram of the house's equipment and how each item connects.
Energy flows and the equipment diagram, from the same results screen.

The PDF report

The same run as a 13-page PDF: a factual summary, the monthly and daily charts, the energy flow diagram, temperature and power curves for the year, a cold week and a hot week, the configuration, and the limits of the model.

Download the 13-page fictional report (PDF)